 to main test page
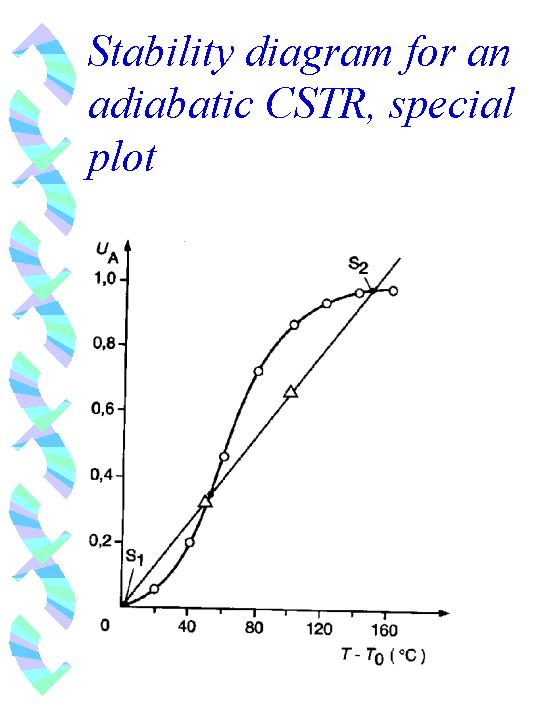
Usually the stability plots of (adiabatic/polytropic) CSTRs show the produced or removed heat(s) versus temperature. But, as already seen for the 1/r(U,T) -plot, it is 'comfortable' to take the conversion as one of the plot-parameters, because this enables a more general presentation (in comparison to e.g. concentration vs T and t.). When we take a plot with the temperature on the x-axis and the conversion on the y-axis, our first advantage is again (as in the 1/r(U,T)-plot) that our function for the heat production by the chemical reaction is a straight line (adiabatic temperature rise! rem: when you take (T-T0) for the temperature, you get a 'normalized' line, running through the origin). On the other side depends the conversion on the temperature as given by the kinetic laws, especially the Arrhenius equation. As we have no 'running' time in a stationary CSTR, - we have only a constant space time (residence time, reaction time), the conversion is a function of the temperature in the vessel. But as already mentioned (and hope in meantime well known) the application of the Arrhenius equation yields a S-shaped curve (for irreversible exothermic reactions, - and some sort of bell-shaped curve for reversible reactions, more ? )). This curve is analogous to the chemical heat production curve in the 'usual' stability diagrams, - but it is not the same!! - we could call it the 'temperature dependent kinetic curve', - whereas the heat production curve is the straight line (adiabatic temp.-rise). If you look at such a plot now, you find again stable and instable operation modes and can discuss the matter in the same manner as 'usual':
take your browser back for previous text or:
to main test page