 to main test page
It is an advantage that the linear relationship between conversion and adiabatic temperature rise is valid for all reactor types, therefore we get a general linear plot of our reactor temperature versus the conversion (with T0 as Y-axis intersection). When we put into that plot additionally the 1/r - function for r(U,T), - that is we take a U-value, search it's T value calculate the k-value for this temperature and then the r value using the related k and U (e.g.: r = k(T)*CA,0*(1-U) for a 1 st order reaction), - then we can find our space time graphically in this 1/r-plot in the same manner as shown for isothermal reactions. The difference is that our r is now not only f(U) but also f(T). Let us look at a plot for an irreversible exothermal 1st order reaction:
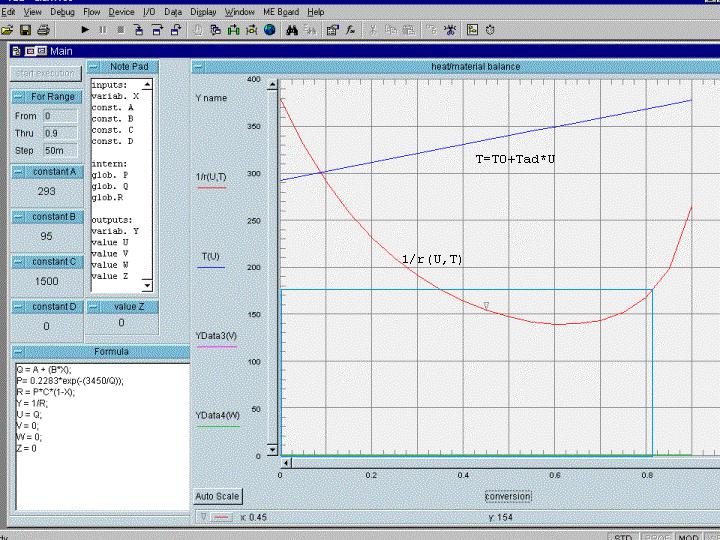
the data: k = 0.2283 exp(-3450/T) 1/sec, CA,0 = 1500 mol/m3, delta Tad= 95 K, T0= 293 K
We see something really interesting here: We have an 'initially falling' function curve, and as the space-time for the not-back-mixed reactor types corresponds to the area under the function curve, we have to realize that these reactor types are not so 'good' in this sector, - up to about 75 % conversion the totally back-mixed CSTR would even be better !! But best would be to take a reactor combination. Here we have another example for the necessity of reactor combinations instead of 'merely' not-back-mixed reactor types.
take your browser back for previous text or:
to main test page